An El Niño Like No Other
Welcome to El Niño. It begins.
On June 11, NOAA officially declared the beginning of El Niño. While El Niño occurs every few years, forecasts for this El Niño are record-shattering, and the climate effects of it later this year may feel like we’re suddenly living in climate forecasts of the farther future.
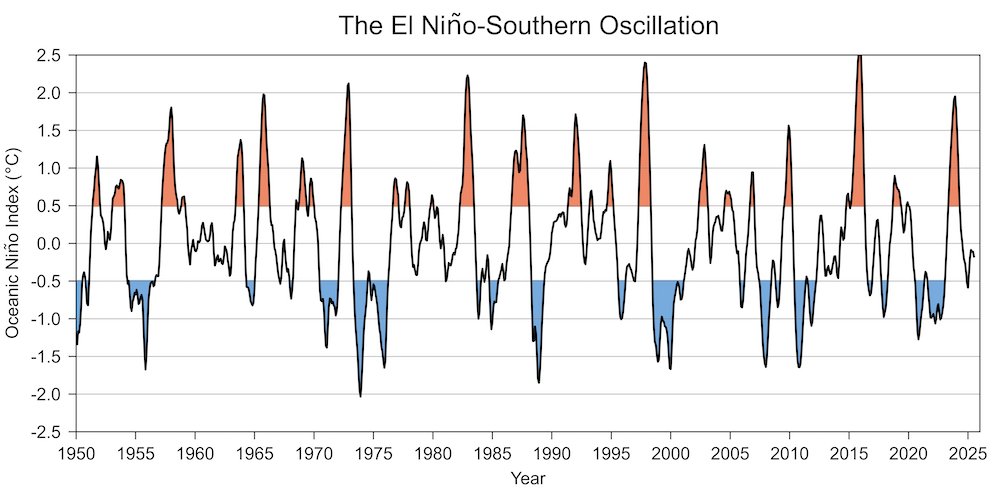
El Niño is a state of equatorial Pacific currents that occurs typically every 2-7 years and lasts 9-12 months. El Niño is officially occurring when oceanic temperatures in a particular area of the Pacific are 0.5 degrees higher than average. La Niña occurs when temperatures are 0.5 degrees below average. Ocean temperatures in this Pacific equatorial band tend to oscillate between very hot or very cool states. Note the typical range of an El Niño, with maximums rarely exceeding 2.5, and most of the time staying well below 1.5, known as a strong El Niño.
The mechanism by which this works is fairly simple. Typically, Pacific trade winds blow west from South America to Indonesia. This pushes warm surface ocean water west and causes cold water from the deep ocean off the Andes to well up, cooling the planet and helping heat absorbed by the oceans to mix with its deeper layers. Sometimes this system works especially well, which causes a La Niña period and tends to cool global temperatures slightly. But every few years, the trade winds weaken and this system breaks down, causing an El Niño. During this time, hot water sloshes back towards South America and cuts off the upwelling, releasing massive amounts of heat during the process. It lasts about a year, peaking around the end of the year. The name comes from the Peruvian fisherman who first noted the phenomenon in the 1600s and named it after its tendency to peak around Christmas. El Niño translates literally to “the little boy,” specifically Jesus. Here’s a gif in which you can clearly see the slosh as equatorial surface currents reverse direction, and the heat that comes with it.
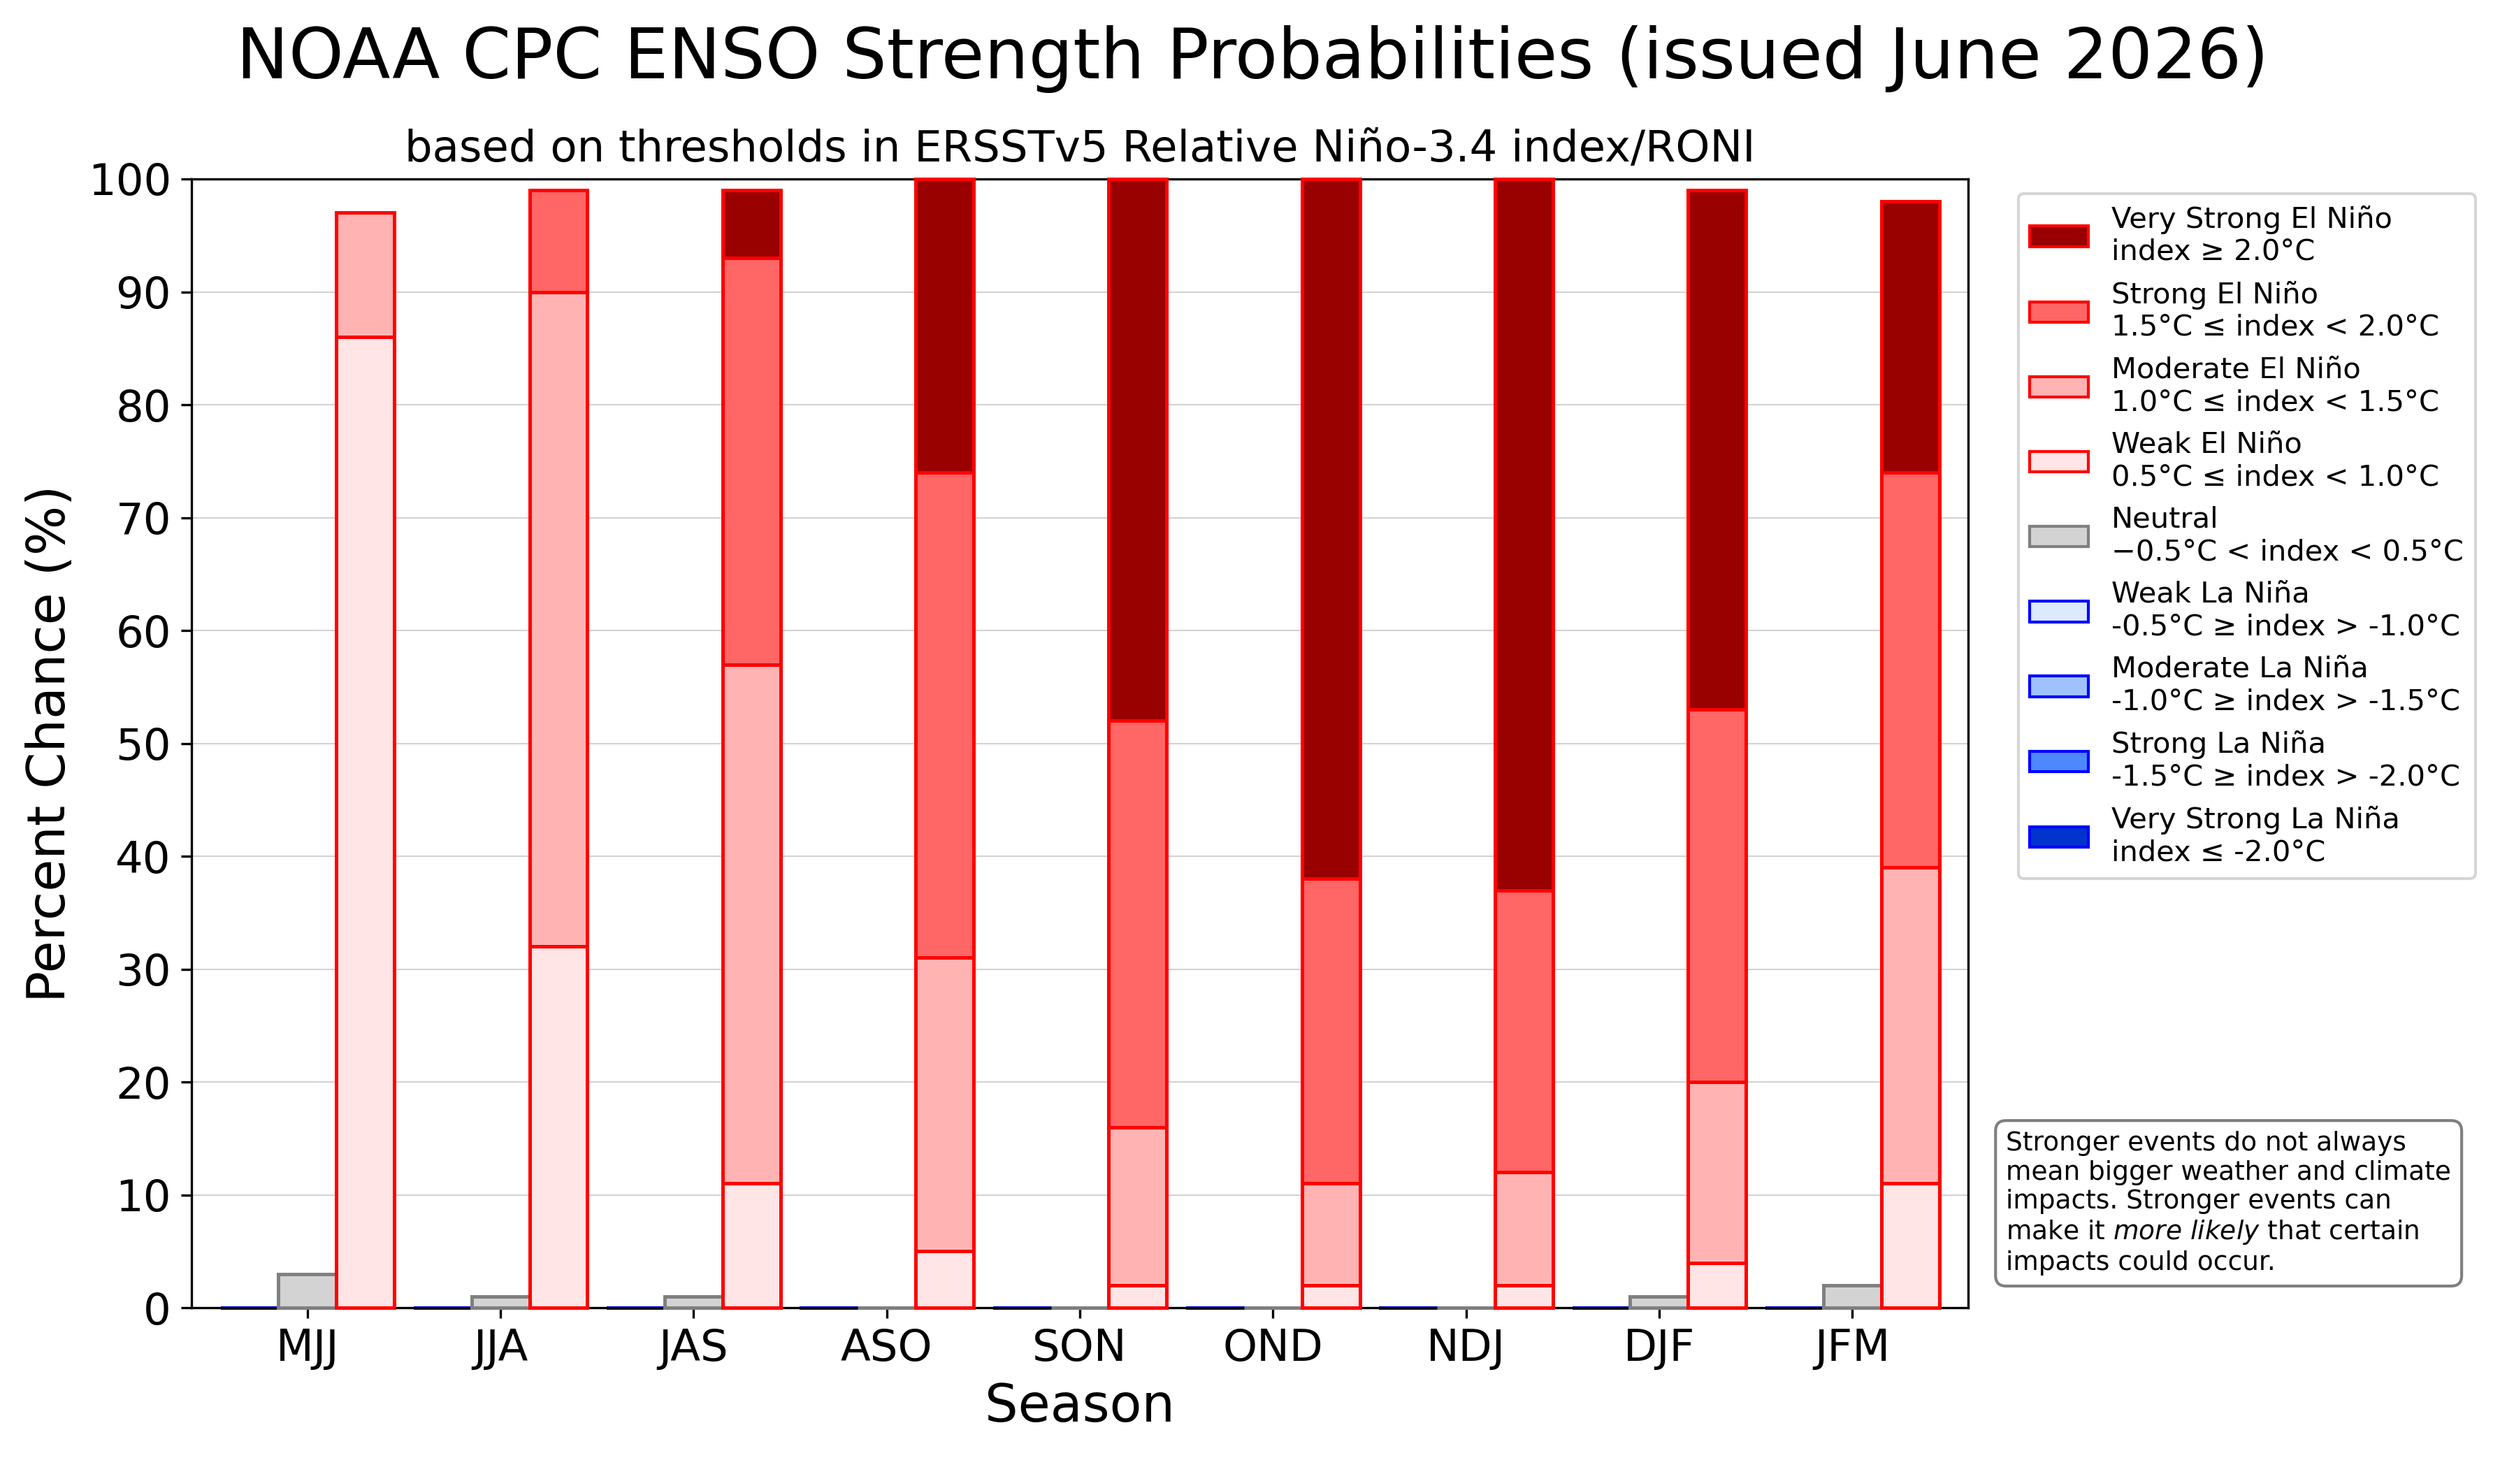
This El Niño is forecast to be the worst this century, possibly ever. NOAA’s probabilities of at least a peak of a strong El Niño, 1.5 degrees celsius above normal in the relevant regions of the Pacific, are above 90%, and probabilities of a very strong El Niño, above 2 degrees off normal, the top end of the scale, are over 60%. But that top end is just a minimum, so it obscures how bad it could get. The top of the scale is 2 degrees because El Niño rarely goes far beyond that, and a higher end of the scale was not necessary. Now people are nicknaming this one the “Godzilla” El Niño. The worst El Niños in history, the 1997 and 2015 events, tied for the highest anomaly at 2.3 degrees celsius above normal.
Forecasts vary significantly in their prediction for the peak, but all agree that this is going to be a big one. A compilation of different models below, from respected climate scientist Zeke Hausfather, gives an idea of the actual potential range. It’s already well into “very strong” territory, and with a possibility of historic temperatures. This is from late April, so it’s a bit out of date compared to recent, worse forecasts.
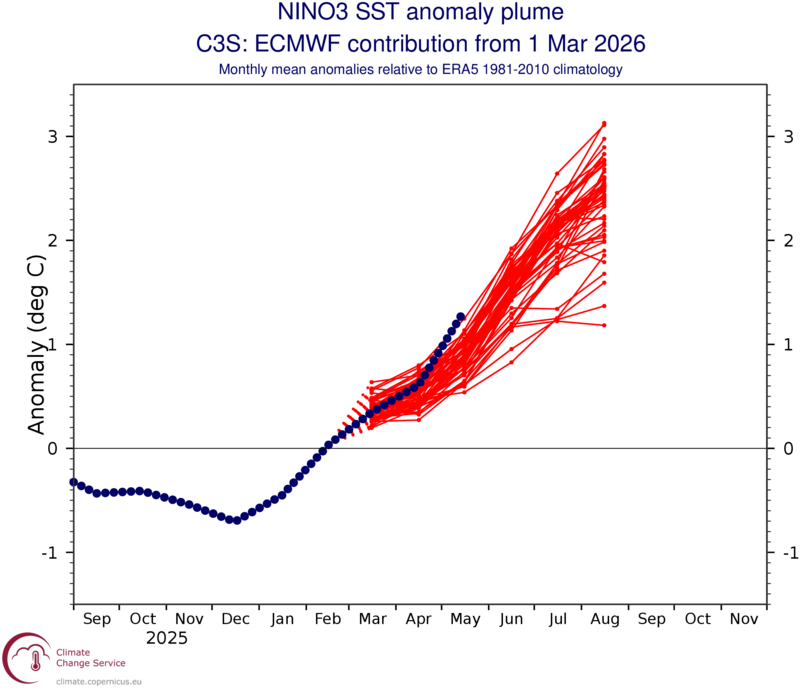
But let’s take a moment to look at models from Copernicus, the EU’s main model, and how they’ve evolved over the past few months. In March, the forecasts caught some attention for predicting a range likely to reach a very strong El Niño. The chart below is the forecast plume in March, the overlay of many different versions of the forecast, and the blue dotted line continues after March to show the actual path the temperatures have taken. But this was limited by the “spring predictability barrier,” a known phenomenon in El Niño modeling, in which it is difficult to predict an El Niño accurately until the start of summer. So, these March models were high, but unreliable. The Copernicus model showed a median around 2 - 2.5 degrees, already among the highest historic El Niños, but at that point, this was far from certain. I started tracking it around then but didn’t want to cry wolf before the more reliable post-spring projections came in.
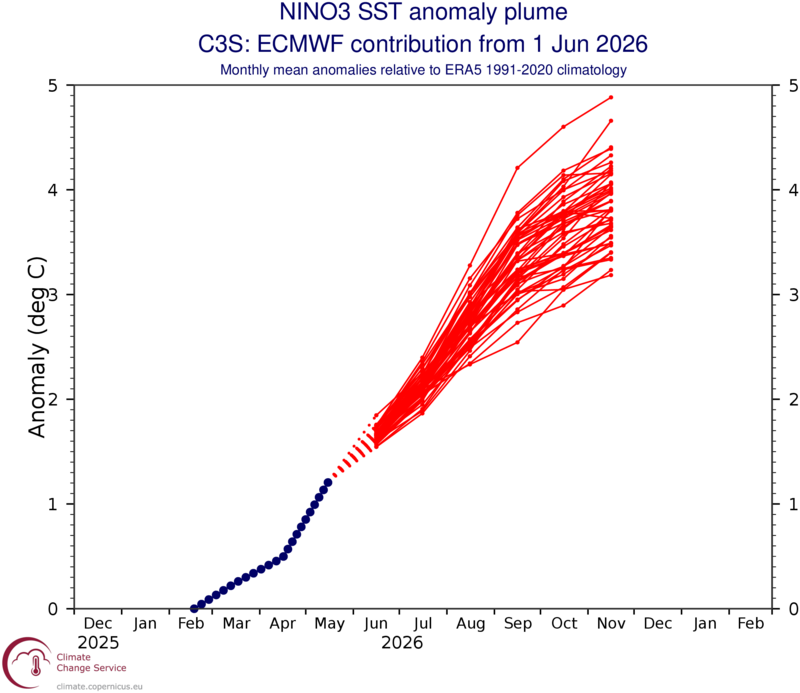
But here’s June, on the other side of the spring predictability barrier. Note that the scale of the y-axis changed to include 4 and 5 degrees. 4 isn’t supposed to even be visible on the scale, let alone 5. So much as a 3-degree El Niño has never happened in known history. That’s the minimum November forecast, with a median of nearly 4. This will be the hottest El Niño in history by a very wide margin.
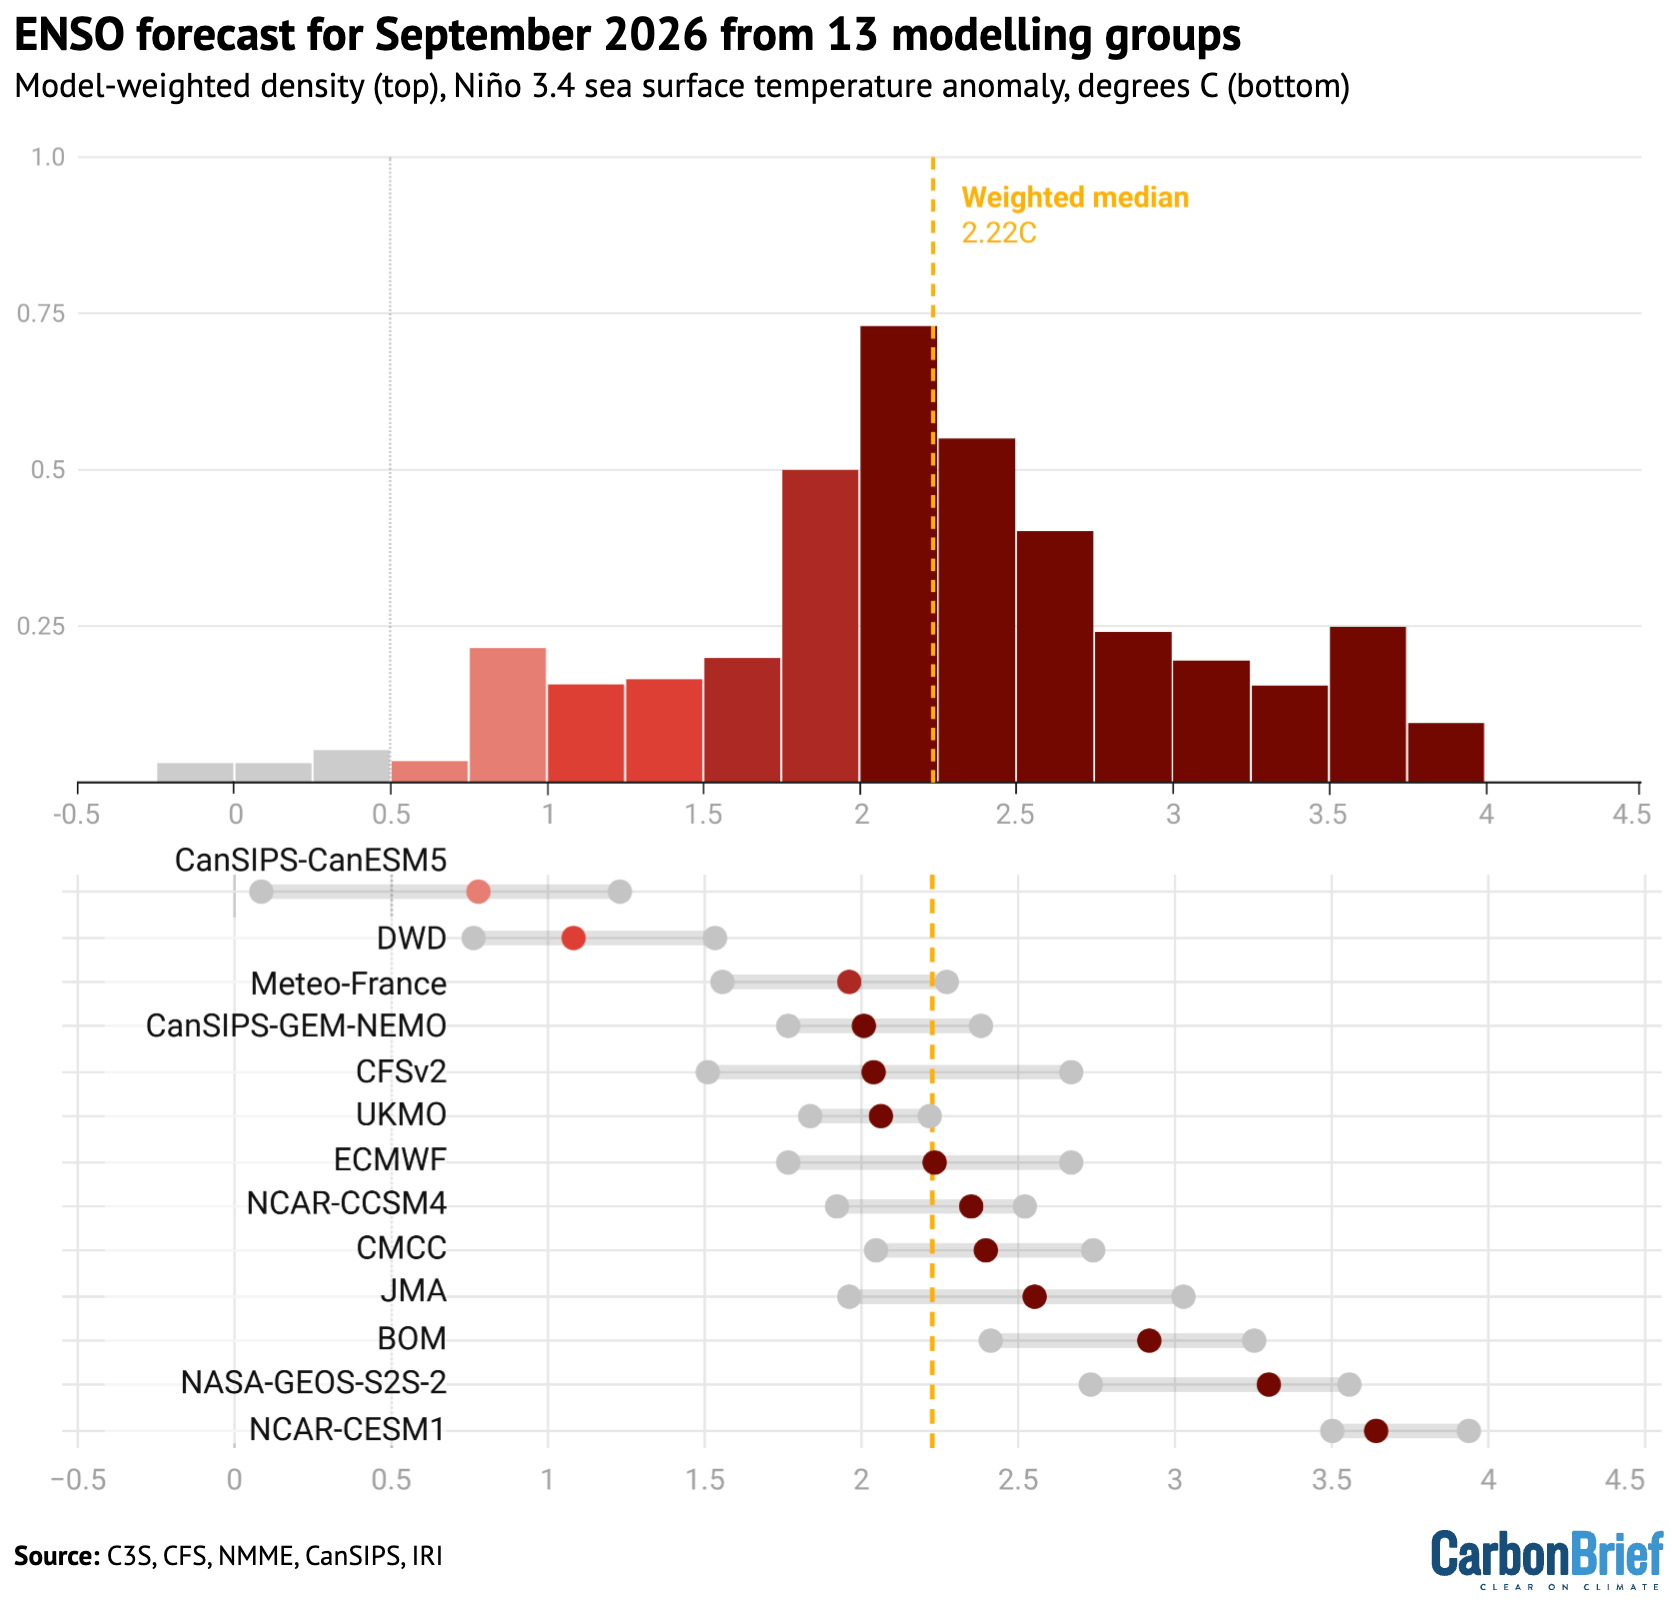
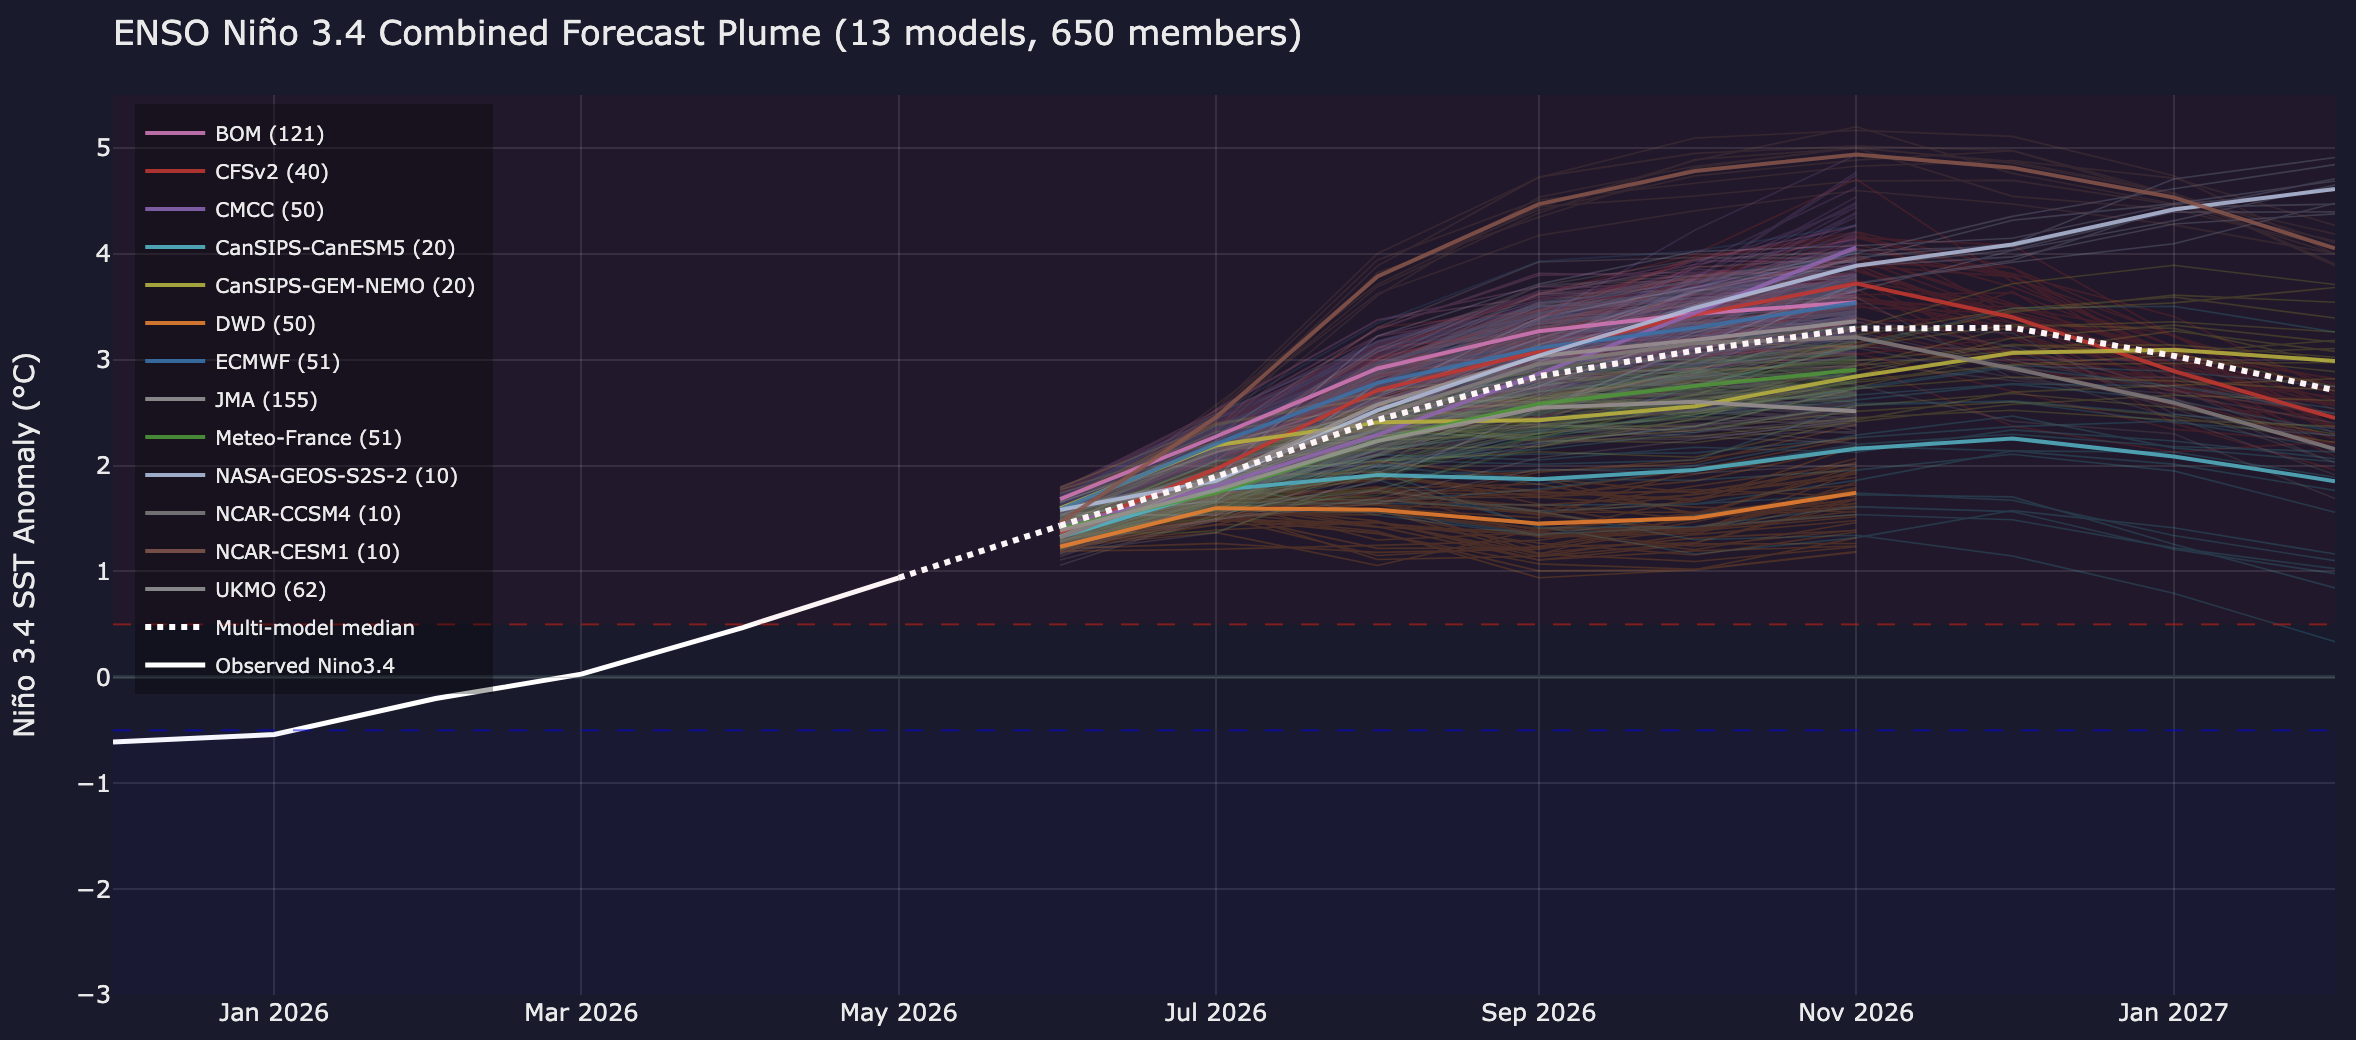
To be fair, Copernicus is on the higher end of the forecasts, but the higher end forecasts have been winning the bets lately. Here’s an aggregation of various different sources, showing a wide range and a median peak of 3.3 degrees, still by far the hottest ever. Whichever way you cut the forecasts, they’re historic, and they get worse every month.
So we’ve established that there’s a very big one coming. It also coincides with a large marine heatwave in the North Pacific, which while unrelated, could mutually reinforce this El Niño. But what does that mean? What are the effects? Global temperatures spike, while the changes in Pacific trade winds and the dumping of heat into the atmosphere from an area that is usually cooler disrupt atmospheric patterns around the world, causing some areas to get too much rain and some too little. These areas are shown in the map below.
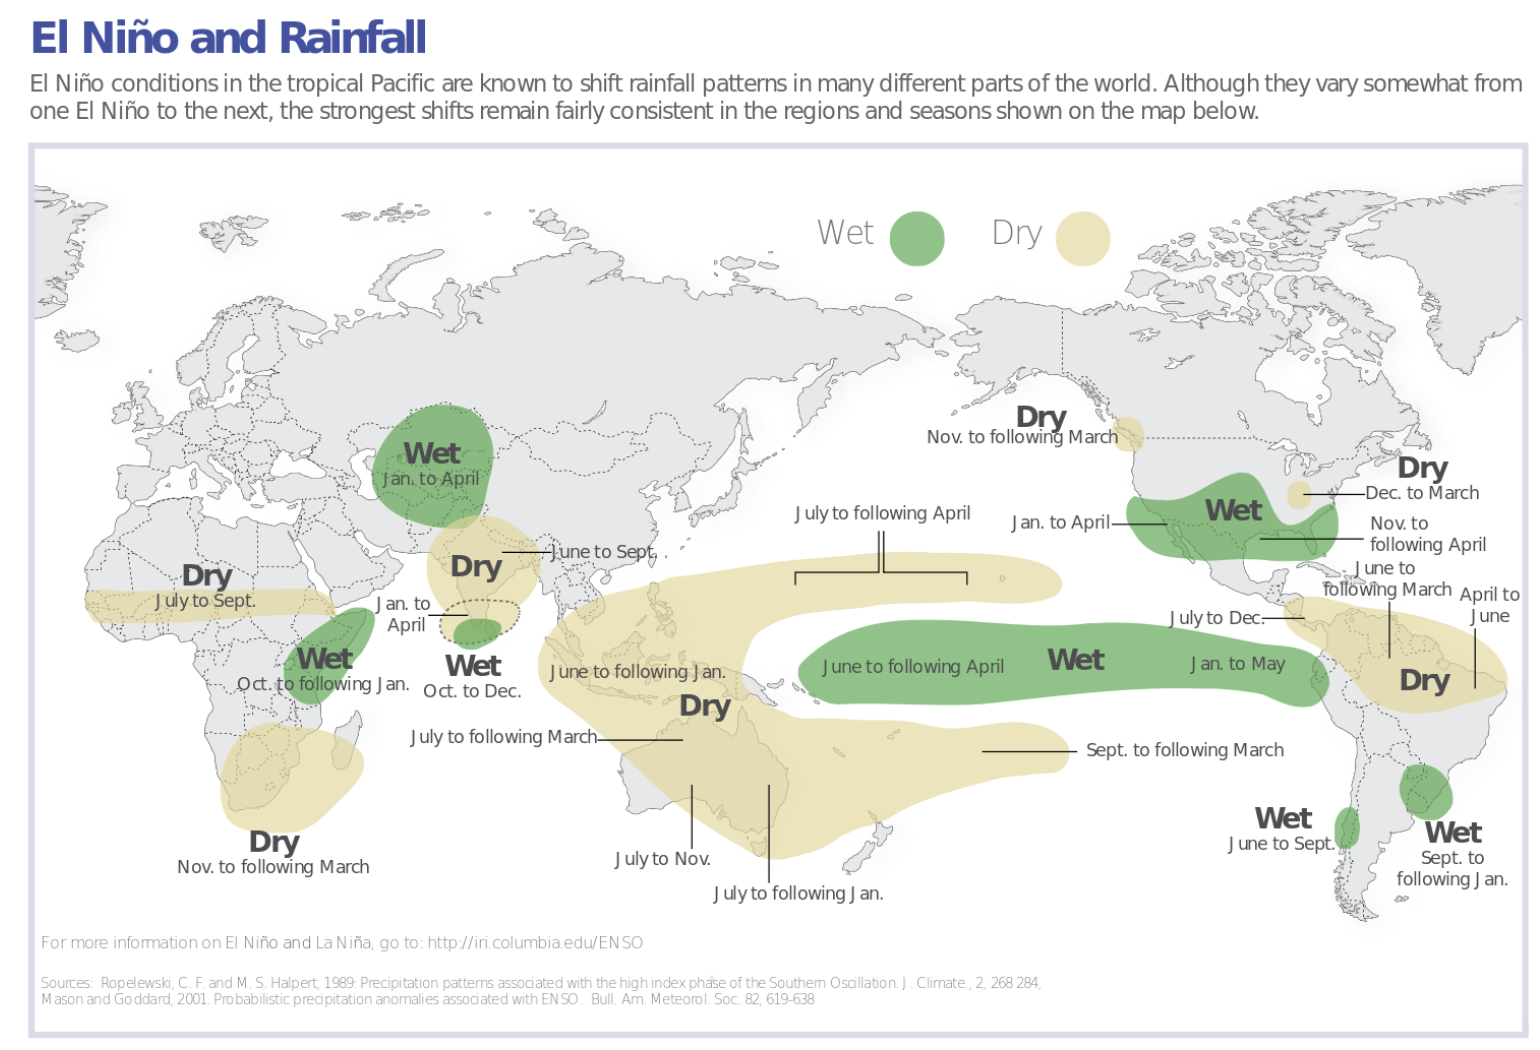
When this map says wet and dry, it’s not kidding. The green regions tend to see floods and landslides, while the tan areas see crop failure and wildfires. Let’s take a look at the areas that could be hardest hit - India, the Sahel, Brazil, Australia, and the southern US. El Niño historically caused fires in the northern Amazon and major floods in southern Brazil. California and the Gulf coast see increased precipitation, raising flooding risk, while the northeast sees hotter summers. Ironically, the increased rain could provide temporary relief from the worsening southwestern megadrought and reduce hurricane risk in the Gulf of Mexico. Australia dries out and sees increased fire risk. The Sahel (that is, the southern edge of the Sahara desert), as well as southern Africa, will see drought and crop failure. This will occur later this year as Sudan already faces a food crisis affecting 20 million people, brought on by its ongoing and destructive civil war.
But the really worrying place is India. El Niño reduces the Indian Ocean monsoon, which provides 70% of India’s rainfall, leading to significantly reduced rainfall across northern India. This causes crop failures of over 10% in some regions, which will increase local food prices and import dependency in the coming year, at the same time as demand for imported agricultural goods may rise across the world, further worsening food price shocks as several affected regions try to increase their imports at the same time. This phenomenon was examined in historian Mike Davis’ book Late Victorian Holocausts, which examined the starvation of 30-60 million people in India in the late 1800s due to a series of strong El Niños, combined with colonial British price speculation and extraction. These deaths were more due to the British continuing to take crops and export them while the countryside starved than they were due to the El Niños, but it was the drought that pushed a strained system over the brink.
While India has become much more resilient since then, the impending drought of this El Niño combines with another Indian agricultural crisis. The closure of the Strait of Hormuz, through which 30% of seaborne fertilizer trade flows from its production centers in the Persian Gulf, poses a concurrent problem for Indian agriculture, as it imports half of its nitrogen fertilizer from the Gulf. Brazil and southern Africa are also heavily reliant on Persian Gulf fertilizer, and could see the same combined stressors as they get drier. Drought in several major growing regions at the same time, while many of those regions are already dealing with fertilizer price spikes and shortages, could reduce agricultural output globally and push up food prices even in unaffected regions.
Beyond the precipitation impacts on certain regions, El Niño also impacts global temperatures. Global average temperature increase is not a perfectly linear process. It goes up and down around the general trend line, mainly led to its peaks and troughs by El Niño and La Niña, as shown below.
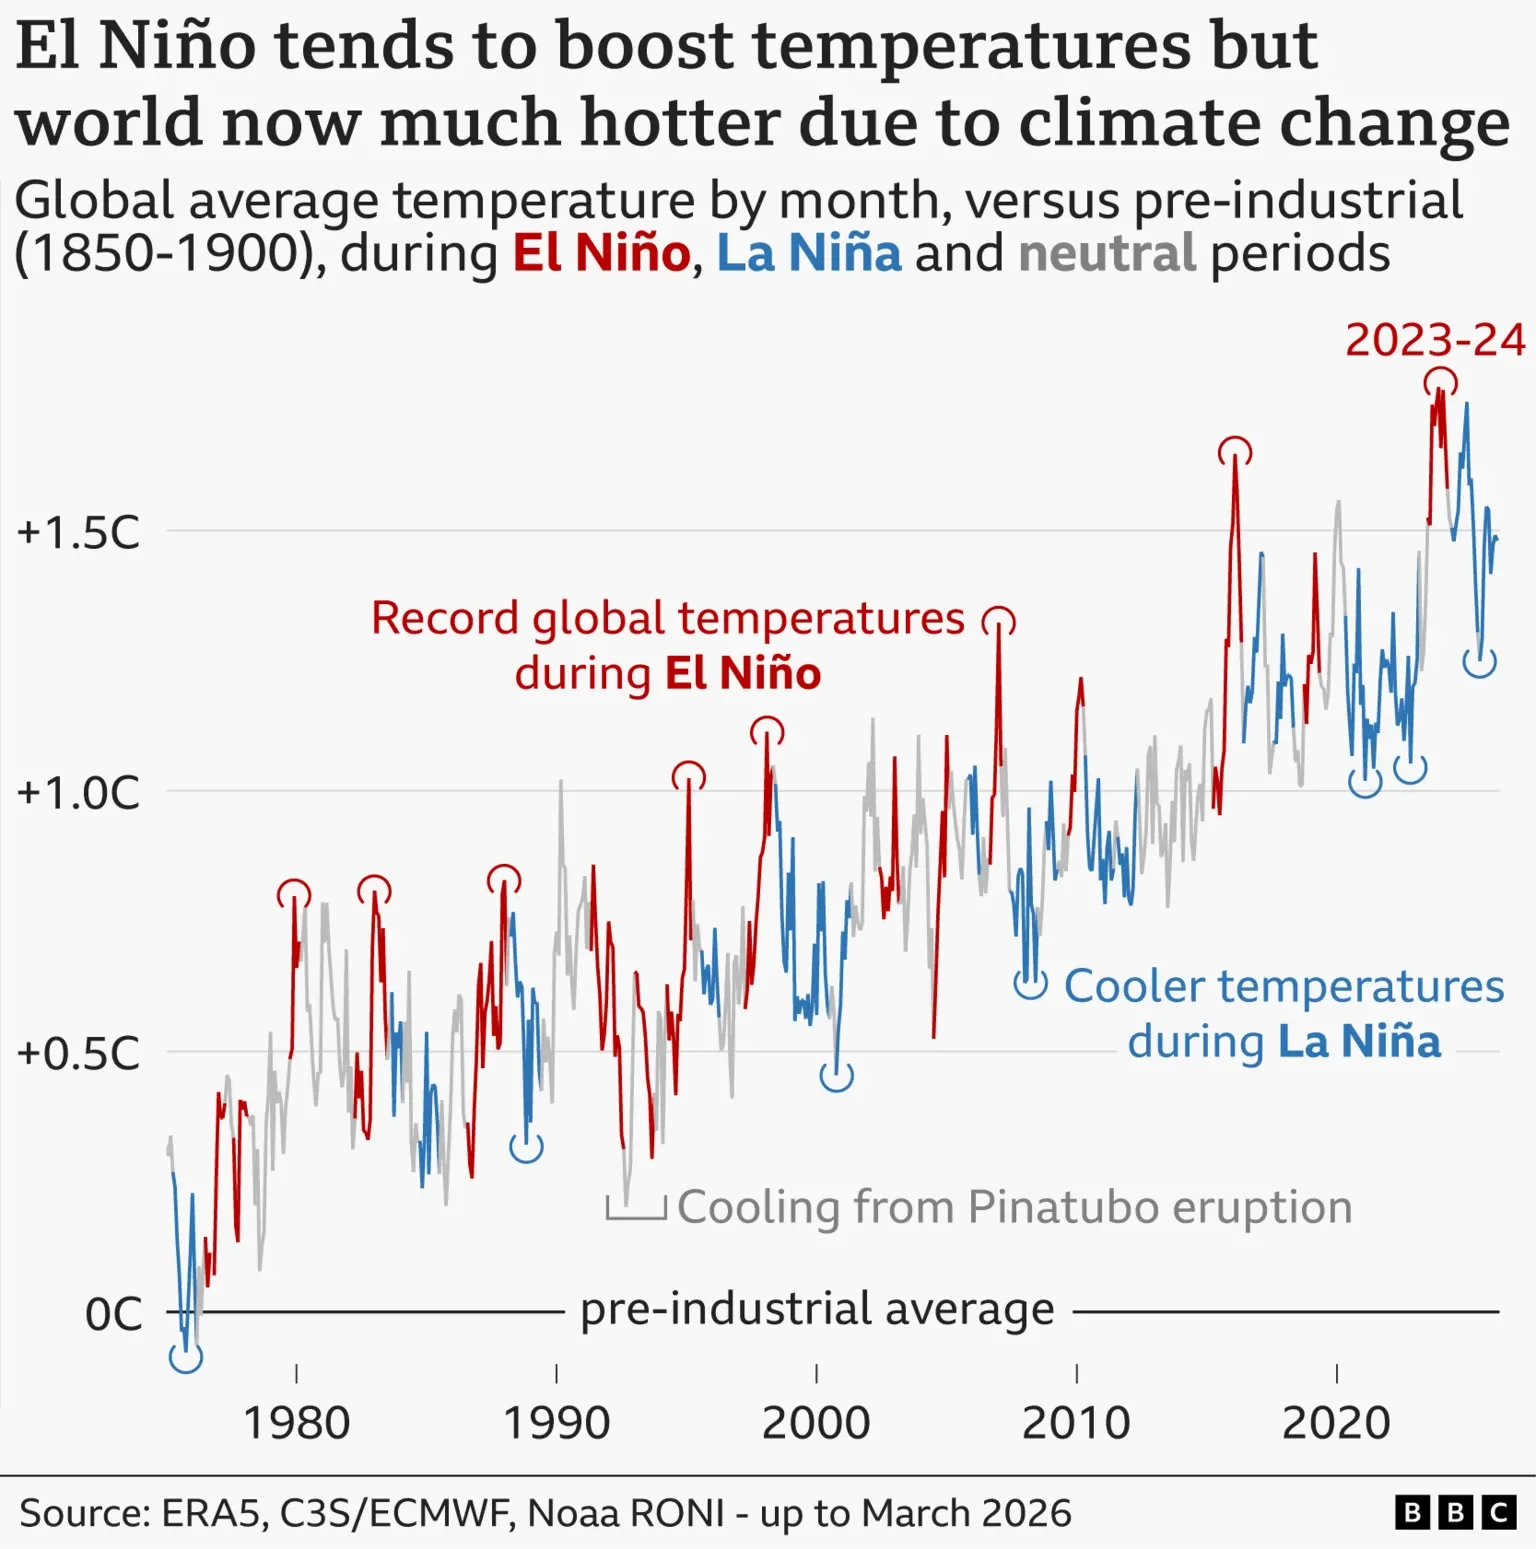
Recent strong El Niños, mainly the 2015 and 2023 El Niños, have been followed by sustained increases in global temperature. This is visible in the right side of this chart, where these spikes bring the world into new temperature regimes, an average around which the temperature oscillates, until the next major El Niño pushes it up. It’s like a discontinuous stepwise function. When a strong El Niño sets a record, it dumps so much heat into the atmosphere that the rolling average for the next few years is pushed up. Global warming is now happening in fits and starts, not as a smooth, continuous line. Let’s look at it another way to see what the 2023 El Niño did to the world.
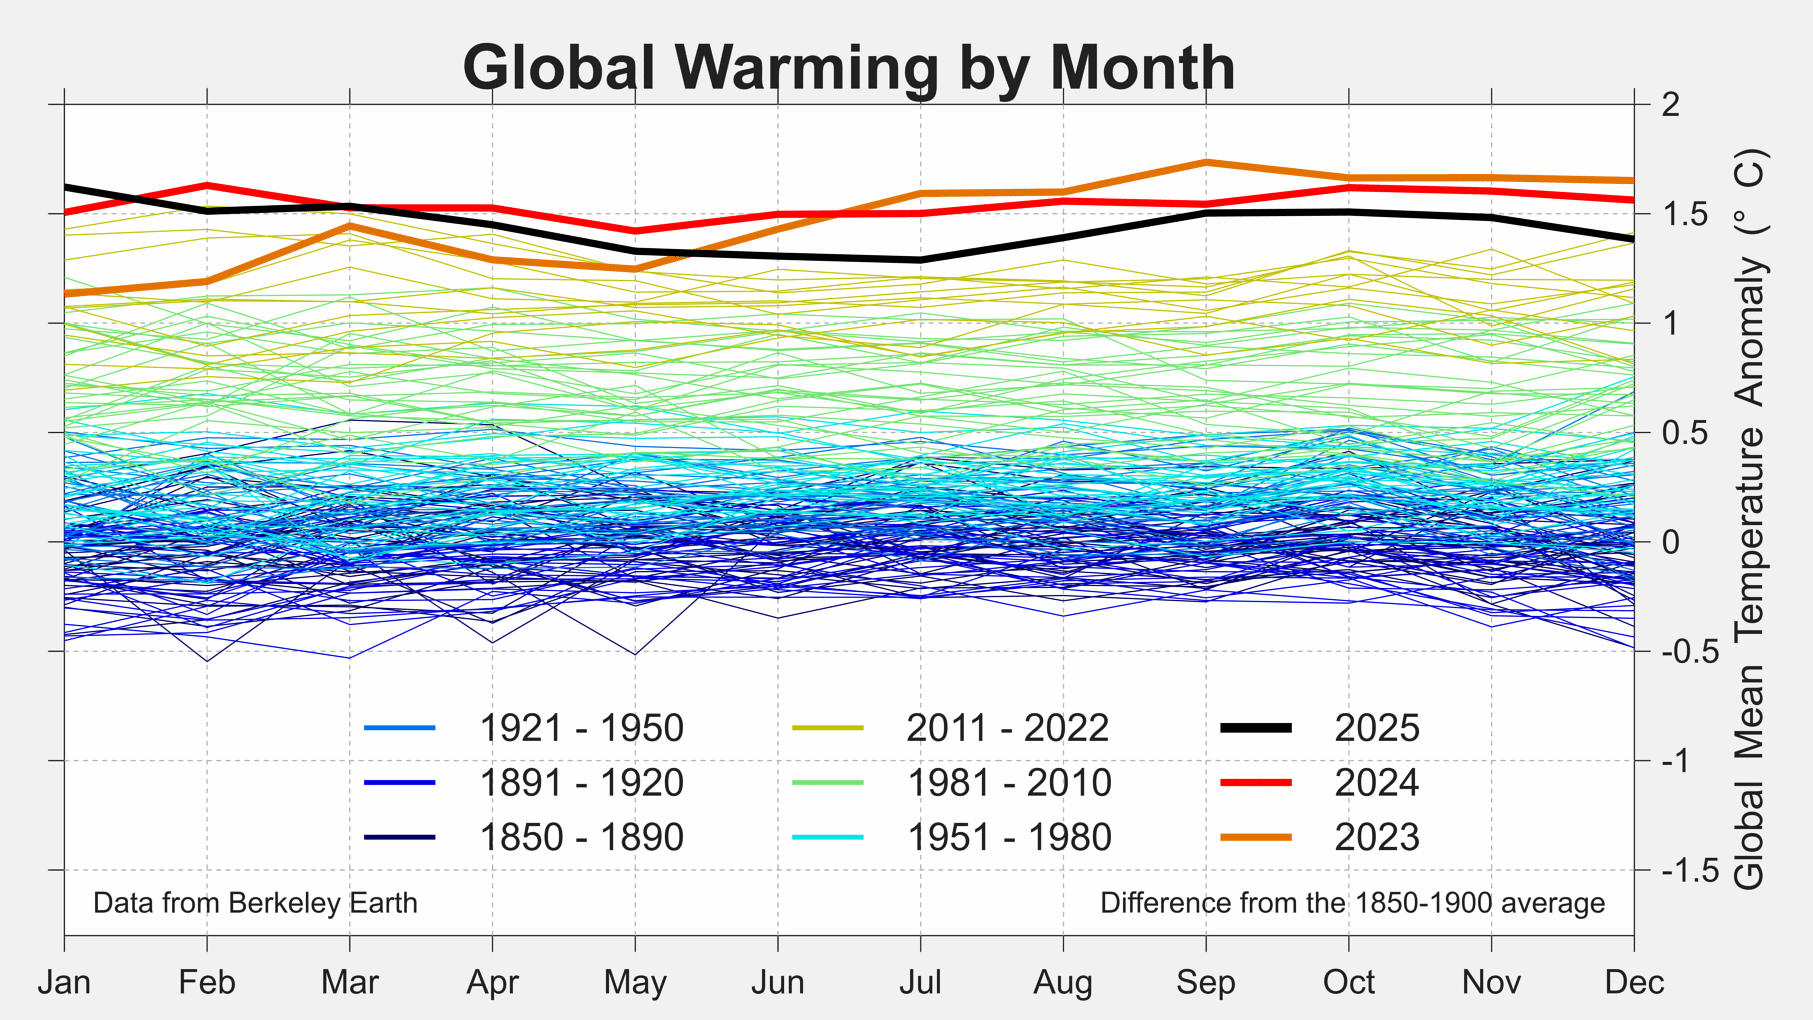
The orange line near the top, 2023, starts out the year hot but not record-setting. Then, in June as the El Niño starts, it spikes above past records by a huge margin. The following year, as shown by the red line, remained above the pre-2023 record temperature for every month out of the year. The increase from 2023 became normal, and the previously alarming spike in the 2015 El Niño was colder than the temperature at any point in 2024. The El Niño then ended that year, and entered a La Niña phase in 2025, during which temperature occasionally dipped below pre-2023 records, but mostly remained above them, and the average for the year was only bested by 2024 and 2023. This is worth lingering on - the 2023 El Niño brought temperatures above the previous record, but then rather than regressing to the mean, they stayed there, and the La Niña didn’t bring them all the way back. This discontinuity is alarming. Temperatures usually spike by much smaller margins, then even if they set a wide gap, subsequent years fill in that gap. But look at September. That sort of gap between current and recent temperatures isn’t supposed to happen. Warming over the last few years has clearly been discontinuous and nonlinear. The 2023 El Niño peaked at 2 degrees, well below past records and current forecasts, and still had this effect.
If the coming El Niño follows the pattern of the last few strong events, 2026 will see a record-setting hot late summer and fall. 2027 will certainly be the warmest year on record, possibly beating by a wide margin the 2024 record, which itself beat the previous record in 2016 by a wide margin. All of those years were the year following an El Niño. The year in which it forms (2015, 2023, 2026) sees its heat spike in the latter half of the year, and the dumping of oceanic heat into the atmosphere is an ongoing process with cumulative effects that manifest most strongly in atmospheric heat after the El Niño has started to wind down in the spring of the following year. We’re in for a very hot 2027.
The oceans absorb 90% of heat energy from global warming. Atmospheric warming we’ve seen in the past decades comes from the 10% of excess heat the oceans do not absorb. This isn’t surprising as a physical phenomenon. Water is very good at storing heat, and covers 70% of the planet. Picture a sealed, half-full fish tank, with a heating element affecting the air at the top. It would be expected that the water would absorb a large portion of that heat at the places where it comes into contact with the air. If the water sits still, the top layer would heat up rapidly and struggle to absorb more heat while heat slowly diffuses towards the cooler deep layers. But if a small recirculating pump were added to the bottom of the tank, the process would be more efficient as cool water is able to come in contact with the air. If that pump were turned off, the air in the tank would get hotter as the water absorbs less, and even lets off some of its absorbed heat as the surface layers pass their heat storage capacity. We really do not want that to happen to any portion of the 90% of additional heat energy from global warming that the oceans hold. But El Niño is when the pump turns off and some of the energy is released.
The average temperature anomaly in 2024 was 1.55 degrees Celsius above the preindustrial average. The goal of the Paris Agreement was to limit global warming to 1.5 degrees, which the Intergovernmental Panel on Climate Change (IPCC) has reported would have severe consequences. The world hasn’t clearly passed 1.5 degrees from one hot year, and 2025 dipped down to 1.44 degrees. For this international goal to be officially declared dead by the IPCC, two decades of warming averaging above 1.5 degrees is required. But by that standard, we won’t know we failed for a decade after the line is crossed. New methods are under consideration, but if we were to pass 1.5 and stay there for several years, it would purely be wishful thinking to say that temperatures could then break their trend and move consistently below 1.5. If this El Niño follows the warming patterns of the previous one, we would see a spike well above 1.5 degrees in 2027, which persists, as subsequent years are somewhat cooler but do not have annual averages below 1.5. The Paris Agreement has been on life support for years, but it may be about to flatline. Just because the doctor hasn’t arrived yet to declare the death of the Agreement’s goal doesn’t silence the heart monitor’s alarm.
Increasing aid to developing countries would help them get through this, and reducing emissions could break the pattern of persistent temperature spikes in the future. Neither of those are going well at the moment, at least in the US. This year, and more so next year, will see crop failures, floods, fires, and the sustained passing of a major global temperature threshold. Climate change is not a morality tale about a set of scary consequences decades in the future if we can’t clean up our act now. That was the case 40 years ago. We didn’t clean up our act, so now these consequences are no longer in the future. They’re here. This is when it begins.